
Surfacing sentiment risk through simulated player outcomes, for game economy designers shipping changes to a live economy.
Every gacha economy is a bet on how much bad luck players will forgive. Drop rates, pity thresholds, and currency rates all get tuned to hit a revenue number, and that math is usually solid. It just doesn’t show the player who lands on the wrong side of the odds and starts posting about it. Most tools built for this only track the payout, not the players it might cost you.
Telltail is a B2B SaaS dual-impact preview tool for game economy designers working with drop rates, pity thresholds, and battle pass pacing in live gacha and F2P games. Before shipping a change, it shows revenue impact and player-sentiment risk side by side, instead of the average-case math most teams ship with today. That average case is the blind spot: it’s what the typical player experiences, not what the unlucky tail feels, and the unlucky tail is usually the one that complains loudest. Telltail runs a proposed change against simulated players across the full range of luck, which is where the name comes from.
Spreadsheets only represent average players, not the unlucky ones
Before designing anything, I looked for evidence that this problem was real. Several job postings, developer forums, academic research, and one very public case of monetization backlash all pointed in the same direction.
itembase.dev is a live, limited-beta competitor built for pull-rate and pity modeling, positioned as pre-launch validation, distinct from post-launch analytics. This validates the space without saturating it.
itembase.dev · dev.to reviewsEconomy designer job postings often expect design and spreadsheet/scripting skills in one person, especially at smaller studios.
Glassdoor · Vivid Games job postingIndie developers consistently describe economy balancing as a recurring struggle, because static spreadsheets show a fixed percentage, and not the streaks players may actually experience.
itch.io devlogs · dev.toPity systems function as both a risk-signaling mechanism and a spending incentive simultaneously, actively shaping spend behavior.
ScienceDirectChina mandates precise reward-probability disclosure; ESRB/PEGI require randomized-purchase warnings. Verifying simulated behavior matches disclosed odds is a real, semi-legal need.
ScienceDirect, regulatory summaryPixonic’s War Robots shipped a drastic economy change that drove strong short-term revenue but upset enough players that key metrics declined, forcing a walk-back.
GDC Vault · Vladimir KrasilnikovBlog posts commonly cite gacha mechanics as 60–90% of hard-currency spend.
Priya does the math right and still gets blindsided.
Priya
Economy & Systems Designer
Priya’s spreadsheet shows the average player’s experience, not the unlucky tail’s — the numbers can look fine and still ship something that upsets people.
How might we help video game economy designers gain awareness of the gap between an unlucky player’s experience and the perfect average player’s experience, before shipping an economy change?
Three initial directions and their insights
Dual-impact preview
Before shipping, show revenue impact and player-sentiment risk side by side (directly modeled on War Robots). Strongest differentiation from itembase.dev, and nothing in the research shows a competitor pairing these two.
Distribution view
Run the change against simulated players, visualize the full outcome spread. This feeds the revenue side of the preview, explaining why the number looks the way it does.
Ambient simulation
Simulation running continuously in the background, flagging risk as Priya types. The math is fast, so an always-on process solves a performance problem that doesn’t actually exist.
User flow
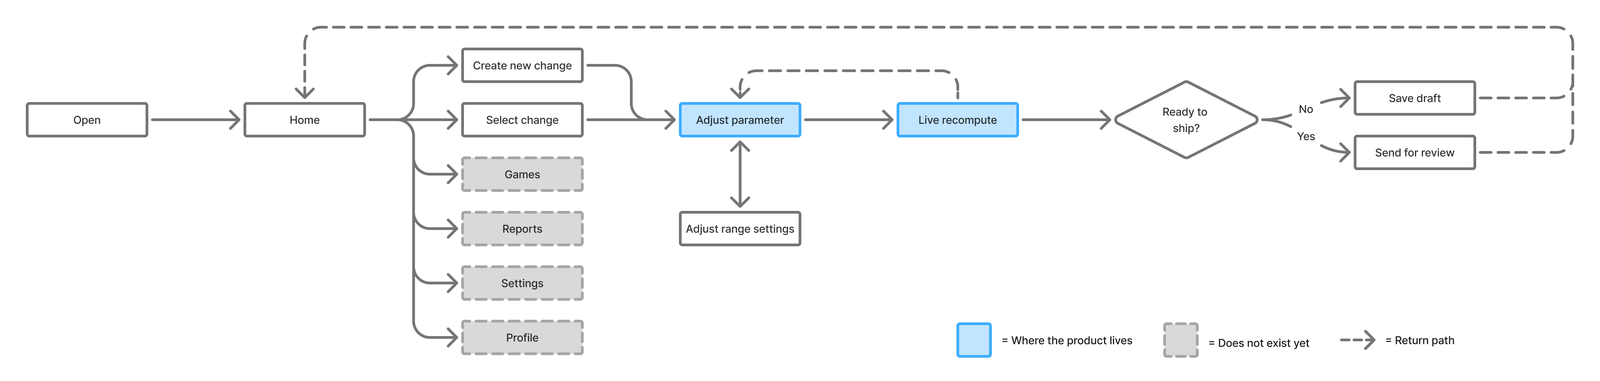
One layout for inputs and outputs.
Parameters/inputs
Live output (weighted by hierarchy)
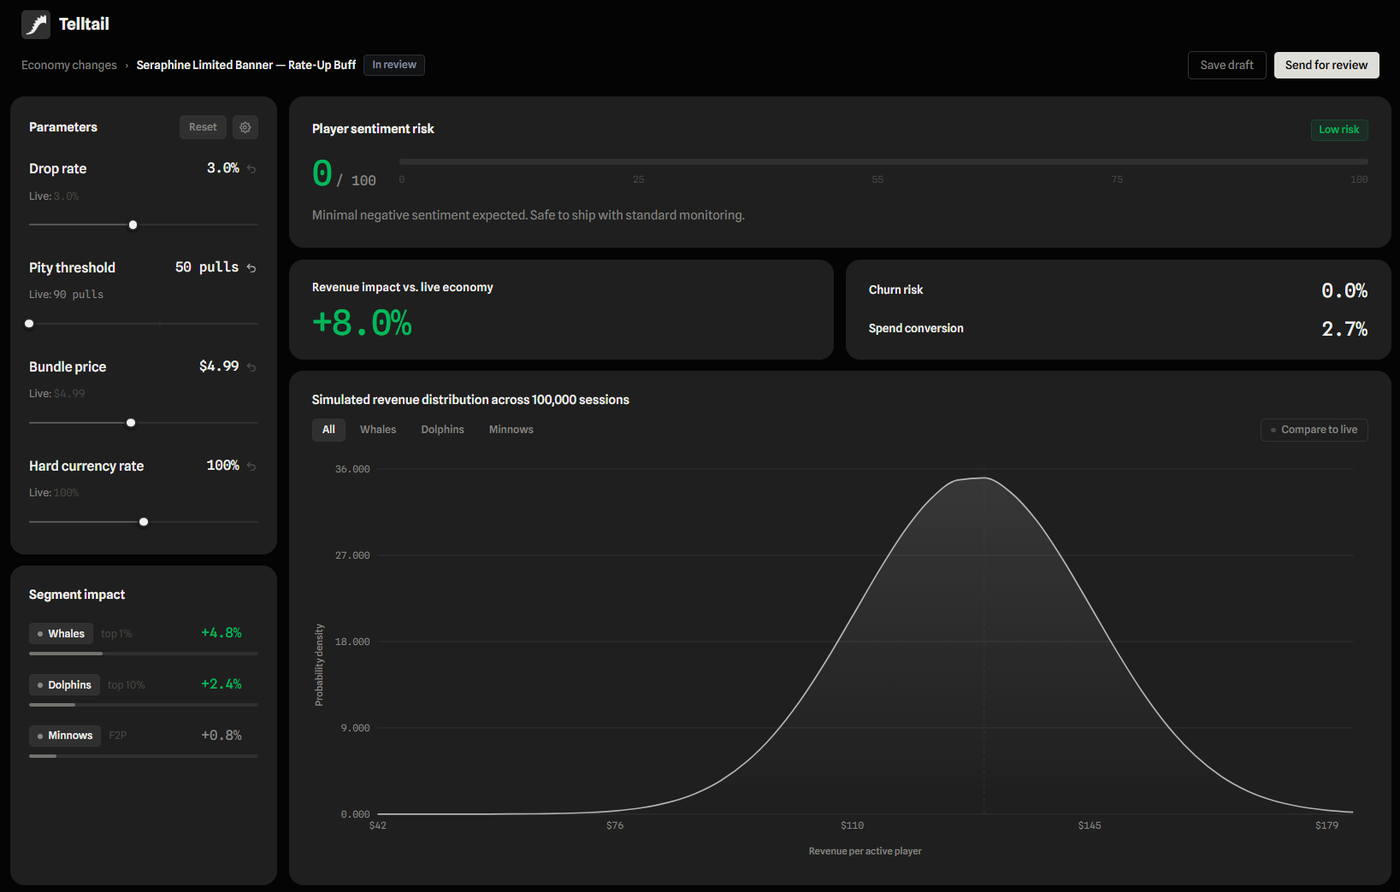
Sentiment risk score
Headline: the gap this tool exists to fill
Revenue impact
Secondary: already visible elsewhere, but still matters
Churn risk & spend conversion
Supporting metrics, paired with revenue
Distribution graph
Supporting detail, attached to revenue specifically
A dashboard for clear decision-making.
Priya is a professional making repeated business decisions, so the UI has to be calm and analytical. This contrasts how a gacha game’s UI is built to create excitement and urgency for players to spend.


To link back to the game aspect, the logo is a dragon’s tail; a nod to economy design still being game design, and a literal reference to the unlucky tail the tool is named for. Typography uses the Spline family: Spline Sans for text, and Spline Sans Mono for numbers.
The color palette is dark and monochromatic, with the exception of semantic colors that always match data type. Risk severity, sentiment score, and revenue deltas stay on one continuous green-to-red scale.
The first iteration
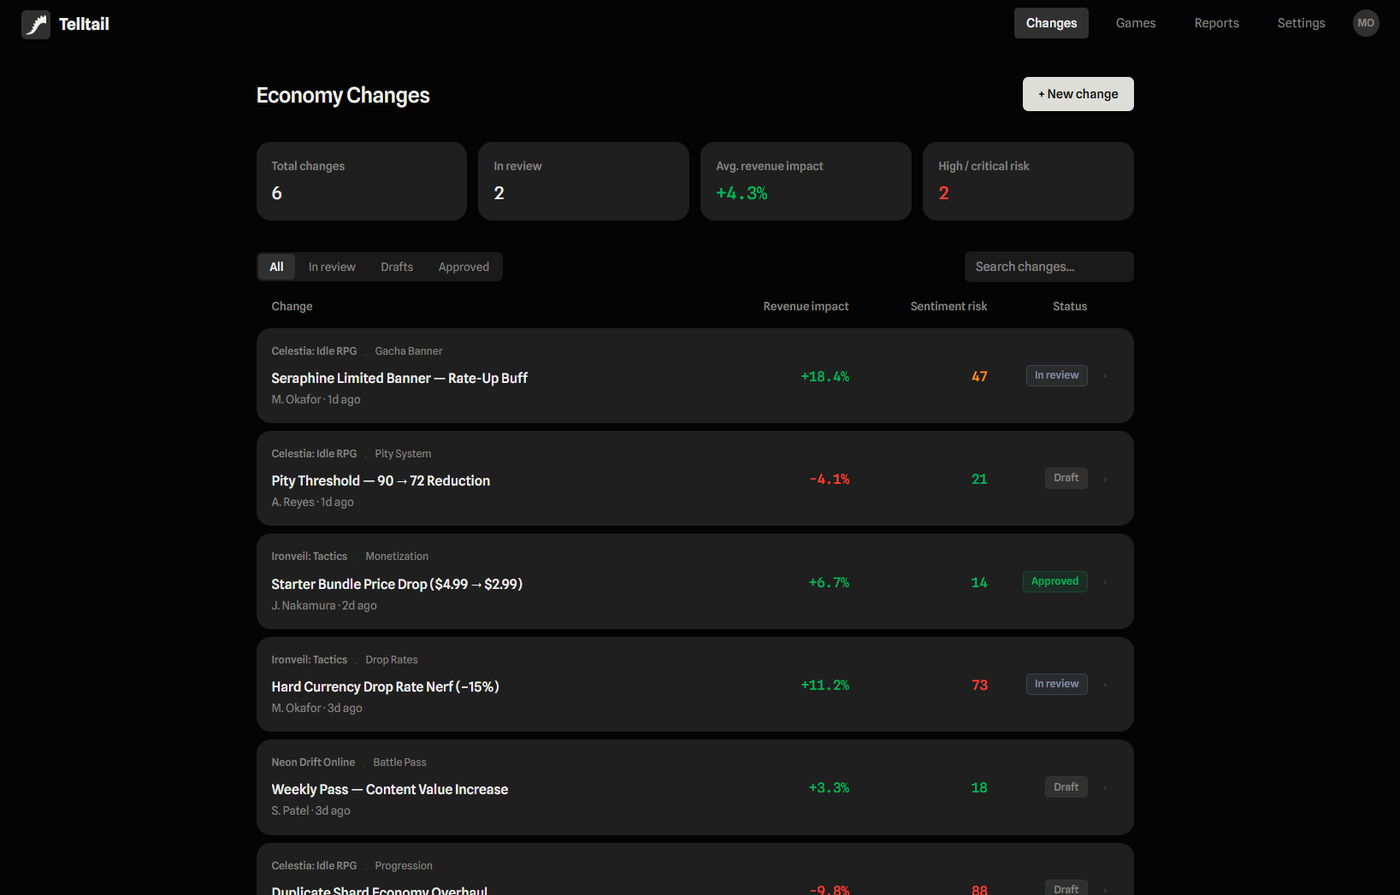
Results, learnings, and next steps
This project furthered my understanding of hierarchy and how it holds up in a real interface, both in user input/output and in information hierarchy: sentiment risk reads first, revenue impact second, and the supporting metrics stay legible without competing for attention. That was one of the main ideas going in, differentiating from how most dashboards default to prioritizing revenue.
There are nuances to mobile game gachas that are not yet accounted for: many gacha games gate a character’s full power behind requiring multiple copies. For example, Genshin’s Constellation system, where a single copy of a character is playable, but not fully realized. That means “unlucky outcome” shouldn’t be just, ‘got the character or didn’t,’ it should account for situations where a character needs multiple copies to actually function.